The Truth About Russia's Economic Power: Is It Really as Small and Weak as the West Claims?
"The size of California?" Not a chance. Delve into the little-known nitty-gritty of Russia's true economic size and productive potential.
Preface: The following article is based on one I previously published on the Saker on this exact anniversary, which I believe bears increased importance in today’s climate. So I have decided to heavily revise and update it with the latest data, tripling its length in the process, to make it as contemporaneously pertinent as possible. I believe this is information that needs the widest possible dissemination to dispel ongoing fallacies, in some quarters of the web, revolving around the size of the Russian economy.
The Trade Deficit Fallacy
In the west, there is a perennial bluster about the putative 'weakness' of the Russian economy. It is widely accepted as 'fact' that the Russian economy is somewhere miserably outside the 'Top 10' global economies by GDP, sinking ever deeper year by year towards #15, embarrassingly behind such smaller countries as South Korea, Canada, Italy and on par with countries like Spain, Australia, and Mexico. In fact, many a snarky joke is bandied about on the Atlanticist web about how ‘Russia’s economy is barely the size of Texas, California, etc.
This is a total western-generated fabrication. In this article, I will prove the following points: that the Russian economy is actually ranked around the top 5 (and arguably even much higher) most powerful on Earth only behind China, US, Japan, and India; that the 2014 western engineered Ruble crisis crashed the specious 'Nominal GDP' of Russia by half while not affecting the true GDP nor economic output of Russia—and how this was affected by the geopolitical factors of the time; and that 'Nominal GDP' is a spurious canard that does not apply to Russia due to Russia being a trade surplus economy, and in fact PPP GDP is the accurate way to measure economies like Russia.
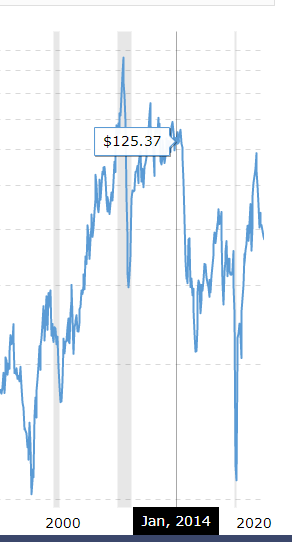
First, let us prove the opening point. Around 2014, oil was pricing steadily in the ~$100-130 per barrel range, as can be seen in the graphic below.
Then, in 2014 a major geopolitical crisis developed. The U.S. and the CIA staged the Ukrainian 'Euromaidan' coup which overthrew the legitimate Ukrainian government in the opening months of that year. A month later, Crimea held a democratic referendum to once more rejoin Russia.
This was a massive blow to the U.S. geopolitically. For this, Russia had to be punished, as it had now grown too strong, winning a major warm water port in Sevastopol that could be used to threaten the western Atlanticist designs in the Middle East by way of a conveniently placed fleet access to the Mediterranean.
The Atlanticists took action, and with their Saudi Arabian underlings carried out a plan to crash the price per barrel of oil in order to hurt Russia as much as possible, since—by conventional thinking—the Russian economy was more tied to fossil fuel production than most other countries (though as you’ll see, this was a bit of a fallacy).
They did this with a large concerted campaign that was multipart: the U.S. vastly jacked up its shale oil production while OPEC was strong-armed into increasing production as well. At the same time, the entire Atlanticist West hit Russia with huge sanctions based on the Crimean seizure and Flight MH17 shoot down falseflag. And lastly, the U.S. orchestrated many Russian currency/bond holders to sell everything (by encouraging ‘panic’, spreading false info about Russia’s collapse—basically spooking everyone). This caused large sell-offs of the Ruble.
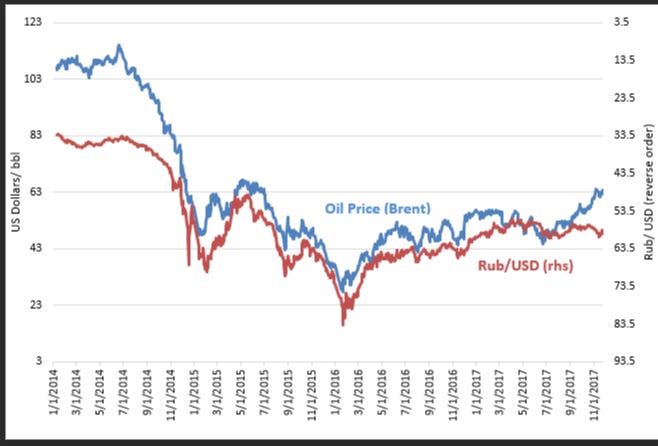
Such large tectonic shifts take time, so their designs took a year or two to fully percolate down into the markets. And by 2015-2016 the price of oil crashed from the aforementioned ~$100-115 per barrel range to the ~$40-50 per barrel range, becoming roughly ~50% of its original price, as this chart below clearly demonstrates:
Now look at the below chart very carefully, and you will begin to see the magic take place. As can be seen, at this exact same time, the Ruble to Dollar conversion rate went from a low of roughly ~37 Rubles to 1 Dollar in 2014, soaring to the range of ~60-75 Rubles to 1 Dollar in the very next year to exactly coincide with the oil price crash.
Miraculously, the devaluation corresponds to the exact timeline and severity of the crash of oil—oil dropped by half from roughly ~$100 to ~$50 and the Ruble also devalued by ‘half’, as it went from ~35 to ~70 against the Dollar by 2015-2016.
Now, continue to follow along and see how the Russian ‘economy’ was halved ‘on paper’ only.
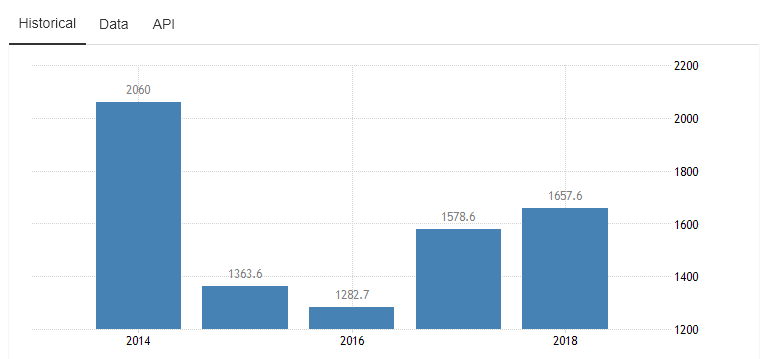
As can be seen by the chart below, Russian GDP—according to this source was $2,060—billion in 2014, and like magic by 2016 it was reduced to $1,282 billion. This represents a roughly ~40% decrease in line with the Ruble crash.
In fact, if you plot the two charts on top of each other, they correspond almost identically. As soon as the Ruble crashed by half, the entire worth of the Russian economy instantly was cut to half-size as well.
But did Russia change overnight in 2015-2016? Was there panic on the streets, disorder and chaos, complete depredation? Disintegration of society? After all, a halving of your GDP almost overnight is of such catastrophic proportions as to be nearly unprecedented in history. Imagine, almost overnight the U.S. GDP going from its current figures to that of its 1960 figures (when it was half of today). What kind of chaos would ensue?
Of course, no such thing occurred in Russia, in fact it was barely noticed. Why? Because, the “Nominal GDP” is a fake, currency manipulated, symbolic number that has no actual basis in reality as pertains to the Russian economy.
You see, the Nominal GDP in each country is priced in U.S. Dollars. This works for countries which are Trade Deficit countries. But a brief discussion of the difference between Trade Deficit and Trade Surplus must be made in order to fully understand this fine point.
A country which operates on a Trade Deficit (which is most country's in the world, including the U.S.) simply imports more items than it exports. It is a country that relies on importing goods from other countries to survive. The reason this is important is because, since the global financial system operates on the U.S. Dollar basis in accordance with 'Dollar Hegemony'—i.e. the Dollar is the reserve currency of the world—this means that when a country IMPORTS items, it is pricing them usually in Dollars, since most trade, particularly of the most valuable commodities like Oil are done in Dollars. So this means that the price of a country's native currency to Dollar conversion is important.
Let's say you are a Trade Deficit country like India, which means you import more than you export, and those imports are largely being priced in Dollars. Let’s assume for argument’s sake, to make the math easier, the Indian Rupee converts against the Dollar at 50 Rupees to 1 Dollar.
That means, if you are buying an imported item which costs $100, and your currency suddenly crashes to where the Rupee now trades at 100 Rupees to 1 Dollar, the following happens: You have to go to the currency exchange store to change your Rupees to Dollars. You are used to exchanging 50 Rupees to get 1 Dollar, so previously the item which cost $100 Dollars would cost you $100 x 50 Rupees = 5,000 Rupees.
But now that the worth of your currency has crashed, and instead of 50 Rupees to 1 Dollar, it now costs 100 Rupees to exchange for 1 Dollar, you have to exchange 10,000 of your Rupees in order to get the same $100 dollars to purchase that item you’re used to purchasing.
But now extrapolate this outward not onto a single individual purchasing something from the internet, but to the entire country which imports billions or trillions worth of its essential goods from all over the world—whether that’s food, oil, medicine, equipment, etc.
So, if your entire economy thrives on imports, then one can clearly see how a currency devaluation of 50% can destroy your economy. It means every essential item you import, items vital to the economic engine of your country, have overnight become TWICE as expensive as before. This would lead to economic devastation.
But, what if your country is a TRADE SURPLUS country, a rarer breed of highly self-sufficient economies—a list comprising only the most advanced first world nations such as Germany, Japan, China, etc.? Russia is in fact amongst this distinguished list. It has one of the largest trade surpluses in the world, while the U.S. is the world's biggest Trade Deficit country, by far.
So, how does a Trade Surplus country work? It is when a country Exports more than it Imports. In summary: the price conversion of the Dollar to the country's currency is irrelevant because if you are generating everything your country needs within your own borders (self-sustainability), you are naturally pricing those items you yourself create in your own currency. So, what does it matter if the Russian Ruble goes from 30 Rubles to 1 Dollar, to 1000 Rubles to 1 Dollar? If you're Russian and you're not importing anything that's priced in the Dollar, and you're buying things within your own country priced in Rubles only, then it makes zero difference what the Ruble trades against the Dollar. Inside the borders of your own country, a Ruble is a Ruble, its price conversion to the Dollar is inconsequential.
For instance: let’s say a large Russian food manufacturer creates millions of tons of food, it prices the food in Rubles and sells it to Russian distribution chains, which likewise purchase the food in Rubles and places it into supermarkets. At no point in that process did they ever worry about converting anything to Dollars. So even if the Ruble went to 10000000 to 1 against the Dollar, it would have no effect on them.
It can be seen here that a native currency devaluation does not have much effect on a Trade Surplus economy. When a Russian citizen goes to a store and buys items, or a Russian company orders equipment or products, they are ordering them in Rubles because Russia makes their own goods and is self-sustaining. Of course, this isn’t completely black and white as no country on Earth—Russia included—is 100% totally export only or import only. Russia obviously imports many things as well, it’s simply that the exports far outweigh the imports.
So, when the Russian Ruble crashed against the USD in 2015-2016 following the manufactured and engineered geopolitical crisis and massive currency manipulation by the corrupt U.S. global financial system, and the Russian Nominal GDP was shown to crash the equivalent rate (because the Nominal GDP is priced in USD), the Russian economy in fact did not take such a ‘major hit’ as implied by its false Dollar-priced GDP devaluation.
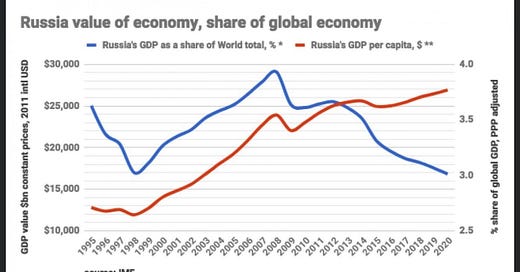
This can also be visualized in the graph above. You see right during the 2014+ devaluation, the Russian economy as a share of the global economy dropped precipitously, simply because its total worth was devalued ‘on paper’. Yet the per capita GDP continued to rise, completely unbothered by the illusory drop. Why is that? If the Russian economy took an actual tangible hit, where real losses occurred, especially to the tune of losing half of its value, do you really think the per capita GDP—which is a measure of a country’s prosperity—would continue rising?
The Russian GDP was shown to devalue from ~2 trillion to 1.2 trillion almost ‘over night’, only when viewed from the false perspective of the ‘Nominal GDP’ chart, which is not the correct way to view a Trade Surplus economy as the ‘Nominal GDP’ list is priced only in Dollars, and therefore heavily skews and distorts the reality of such economies.
All that actually occurred was a fraudulent mathematical calculation changed the numbers by way of Dollar conversion to make it ‘look’ like the Russian economy lost half its value overnight, but actual Russian economic productive power and output did not experience any such effect. It was a smoke and mirrors currency manipulation that, for the most part, existed only in the digital bits and bytes of a computer screen.
But some might ask, why then did the Ruble crash to half its worth just as the price of oil did?
Typically, as can be seen, Russia’s Ruble does follow the price of oil. And on the chart above, you can even see it mirroring the aforementioned dip in 2014. So the astute question would be, since the Russian economy is so tied to fossil fuels, doesn’t this in fact represent a devastating hit to its economy?
A few points in unpacking this: firstly, fossil fuels (oil/gas) typically comprise anywhere between 12-20% of Russian GDP—it changes year by year. The number for 2014 I found was about 14%. Now, out of this 14%, gas makes up anywhere between 6-8%. So that means oil alone makes up only in the region of 6-8% of Russian GDP, at least in that year. And oil is what we’re talking about—that’s what crashed, not gas.
That means, it’s a very long stretch to imply that a commodity which makes up 6-8% of the Russian economy crashing by 50%, would lead to the entire economic value of the country likewise halving almost overnight. Here’s a good article explaining some of this more in depth, including Western misconceptions and constant over-estimations of oil/gas’s share of the Russian economy.
By the way, as a quick aside, the above quoted article gives the percentage of total Russian exports that oil/gas comprise as roughly 30% (this is different than the percentage of total GDP). What’s interesting is that, with the recent surge of U.S. energy to Europe in order to unseat Russia as the top energy supplier, the numbers I have found for U.S. show roughly $800+ billion as the oil and LNG gas share of a total $2.5 trillion exports. That means oil and gas now likewise make up more than 30% of U.S. total exports. Who’s the gas station now?
But back to the topic. The real reason for the Ruble’s fall was mostly psychological: at the time of the oil price collapse, the Russian central bank was ‘praised’ by the West for letting the Ruble ‘free float’, rather than tying it to gold for instance, as Russia did much later. But since the West (mostly the U.S.) so heavily spooked investors and holders of the Ruble, encouraging them to dump it while also greatly incentivizing it in many ways, they basically engineered its oil-shadowing drop. Russia could have easily propped the Ruble up, but the central bank decided to let it fall, at least part of the way.
But ultimately, the Ruble’s exchange rate with the USD does not make a whole lot of difference as to the actual productive value of the Russian economy. For that, let us examine the actual worth of the Russian economy itself.
Measuring Russia’s True Economic Power
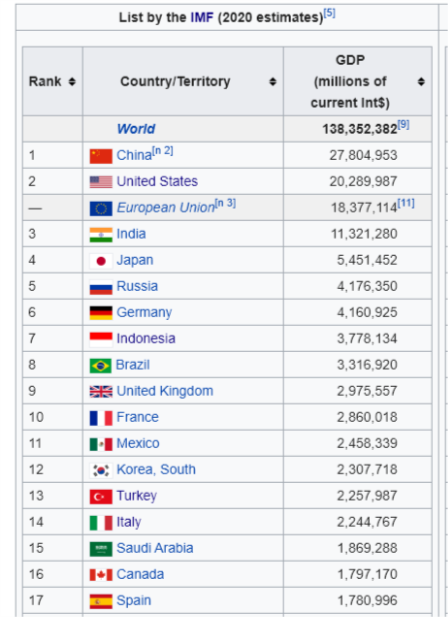
So, if we now understand that the Russian GDP calculation was incorrect, what is the true way to measure it and what is the real Russian GDP? Since we know that Nominal GDP (which is priced in USD) is a fraudulent way to measure the economic power of Trade Surplus countries like Russia, the answer lies firstly in PPP GDP.
At the time of the article’s original writing, Russia according to some sources like the IMF had even overtaken Germany in the GDP PPP index.
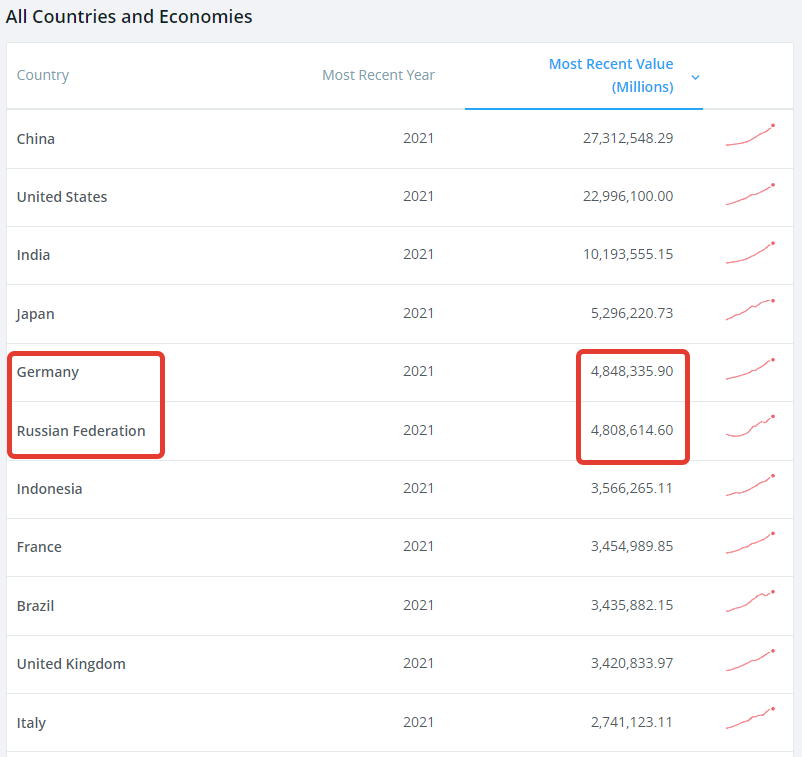
The latest World Bank figures I could find currently, from their official site, show Germany and Russia neck and neck for 2021:
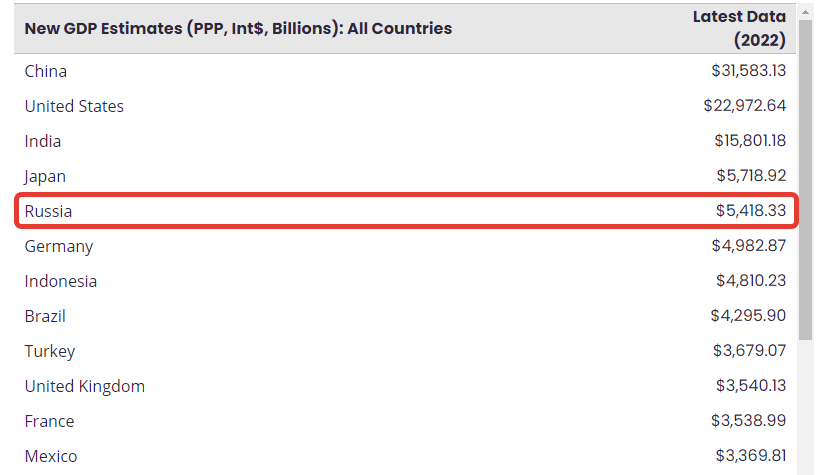
And since everyone calculates it slightly differently, other sources have it with Russia well ahead for 2022:
But what is most interesting, is that prior to the fake 'on paper' devaluation of Russian Nominal GDP following the manufactured crisis of 2014-2016, even the Russian Nominal GDP was near the Top 6-8 place (depending on which source you used, IMF, Worldbank, etc.). And now we see the PPP figure matches this rightful, accurate position.
Think about it logically: if Russia’s actual economy had degraded by ‘half’ overnight in the way represented by the Nominal GDP, wouldn’t it ultimately reflect in its GDP PPP as well? After all, an economic degradation is a degradation no matter what. If there are actual, tangible manifestations of a massive economic destruction in a given country, it will be seen and felt, and represented even in the PPP figures.
So what could possibly explain a literal halving of the Nominal GDP by nearly 50%, yet the PPP index continuing to rise to the point where Russia even overtakes Germany as the #1 most powerful European economy? And the fact that nearly nothing changed or ‘collapsed’ in the country at the time? In short: it was just an abstract numbers game—the Russian economy did not actually change much.
But everyone has seen the PPP figures and knows roughly where Russia stands on that account. More important is: how do we know the PPP figure is accurate? Can we prove that PPP value is more in line with Russia's true economic standing than the Nominal GDP value?
This is the part where it gets interesting.
There are a few correlative indicators that can prove this for us. Several indirect tell-tale signs that experts use to look past fraudulent currency manipulated GDP numbers and gauge the real economic strength and productive capacity of a country.
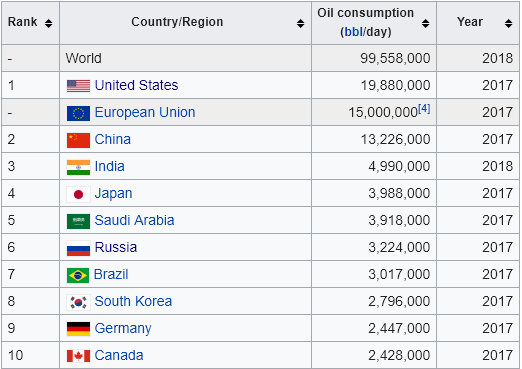
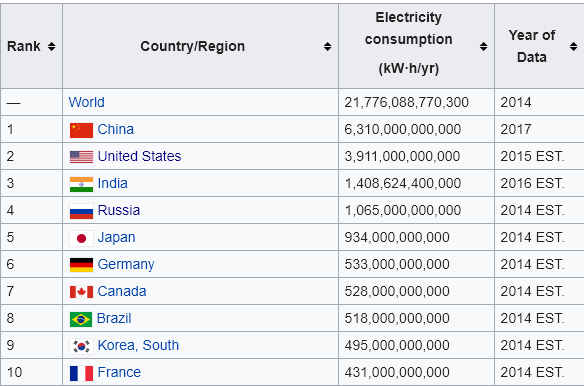
For instance, let's take a look at annual oil and electricity usage by country. These are important indicators that very closely correlate with a country's economic power for reasons that should be self-evident: the more robust one's economy, the more that country will be utilizing oil and electricity in the daily function and growth of that economic engine.
Some may be unconvinced, until looking at the chart above and seeing how well it correlates to the typical GDP standings. The chart shows oil consumption by country and in fact, the top 10 all looks quite similar to, and closely mimic, the PPP GDP chart.
Russia here is seen at #6 just like in the PPP economic standings, NOT in #11-15 place as the Nominal GDP would have you believe. The skeptic might ask, well wouldn't a large population country be over-represented on this chart because they use a lot of oil? To answer that, take Indonesia for example: it has a population almost double that of Russia, yet it is somewhere in the ~15th place in the oil consumption chart. Not surprisingly, this reflects its standings in the GDP list as well.
So, as one can see the size of your country or population count is not reflected in the oil consumption chart, in fact it correlates directly to a country's GDP, with one or two outlier/flukes such as Saudi Arabia, which appears high on the chart owing to its over-reliance on gratuitously consuming vast amounts of oil in the process of producing oil and gas in their oil centered economy. The skeptic might similarly ask, well doesn’t Russia also produce a lot of oil? Yes, but in this case, as I’ve said, its position in the oil consumption perfectly matches its GDP PPP position, not to mention that there are further indicators below that lay the doubts to rest.
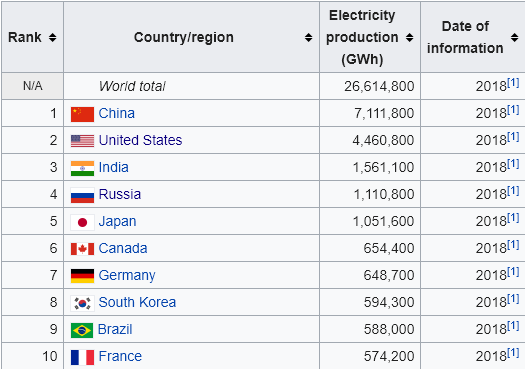
Now let's look at two other indicators of a robust economy: electricity production and consumption.
As can be seen here, the figures also mimic and correlate to the GDP PPP figures. The same countries that dominate the Top 10 economies are seen either producing or consuming electricity at rates that correlate to their economic power. Not coincidentally, here too we see Russia placing near the Top 5, just like in the GDP PPP.
Now remember, these figures are not merely a product of population size. If that was the case, then countries with far larger populations than Russia like Indonesia, Nigeria, Brazil, Bangladesh, and Pakistan would all be way ahead of Russia on the list of energy consumption—yet they are no where on the list.
Similarly, countries with SMALLER populations like Germany would not even be in the top 10. Yet Germany is an economic power house, and despite having a much smaller population than Russia, appears close to it on the list in perfect accordance with its place on the GDP PPP chart. This clearly indicates that a country's energy production/consumption closely and correlatively correspond to its economic power, rather than mere population size.
Another indicator we can use is total Gold Reserves. These figures also mimic economic standing as only the most economically powerful countries appear in the top 10 in roughly a similar makeup as to their official GDP standings. Gold has long been a telltale indicator of a country’s might, prestige, and economic status. In the chart below, we can see once again, Russia ranks in almost the exact position of its GDP PPP standing as in all the other charts above.

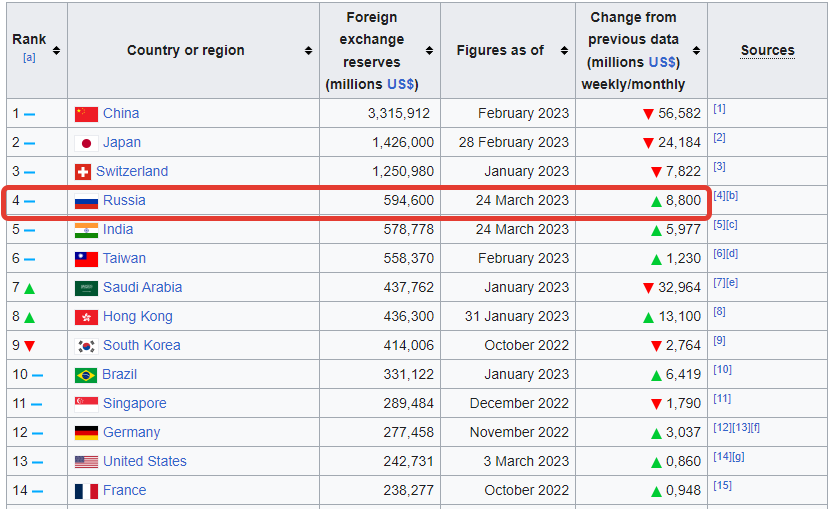
And how about foreign exchange reserves, a sure sign of the health and vitality of any developed country’s economy. This is the very fund that the West attempted to ‘seize’ from Russia, although as I have outlined in previous articles, they didn’t succeed in the way we were led to think. Notice once again, Russia’s top position corresponding similarly to its economic standing:
Of course we can use many other indicators, for instance global military standings. It is widely accepted Russia is at minimum the 2nd most powerful military force on Earth, and the military standings roughly correlate with the same countries in their economic positions—with the familiar faces of U.S., Russia, China, India, Japan, et al, making up the top of the list.
Would you really believe that a country with the acknowledged #2 military in the world is only ranked #15 economically, as per the fraudulent, currency-manipulated Nominal GDP list? It beggars all logic. Of course, the only rational explanation is that only a country whose economy is in the top 5 powerhouses can maintain the 2nd most powerful military in the world.
And most interestingly of all, there is even an indicator specifically made for this type of meta-economic analysis. Called the Composite Index of National Capability, it is a “statistical measure of national power” which derives its list from the measurement of different components like demographics, economic strength, military power, etc., running them through a formula. Not surprisingly, it also utilizes energy consumption in its algorithm, which is as follows:
And what is the final tally of the top 10 countries according to this list?
Big surprise—Russia is again in its exact, precise position, only behind the powerhouses of China, US, India, and Japan.
One can see that all indicators point to Russia being in the top 5 global economies, and that even the fraudulent Nominal GDP figure had Russia at #7 or #8 (depending on source) prior to the artificially engineered oil crisis and currency manipulation that plummeted the Ruble exchange rates in 2014-2016.
But the other big thing to consider is that all this discussion is done in a vacuum, of all things being equal. But one can quickly forget that the Russian economy is the most beleaguered, manipulated, and sabotaged in the world, in terms of sanctions, embargoes, and every form of outright economic terrorism the Western Atlanticist powers wage against it.
So the most sanctioned, embargoed, and economically sabotaged country in the world, still manages to maintain a roughly #5 position, even ahead of powerhouse Germany. This begs the question: what is Russia’s true economic potential? It is clear that, adjusted for this, Russia would likely be #3 behind only China and US were it not for the historically unprecedented handicaps placed against it.
And in fact, some have done the calculations and showed that in truth, the Russian economy is closer to being only about half the size of the U.S., rather than 1/15th or 1/20th, or whatever the absurd Nominal GDP figures would have you believe.
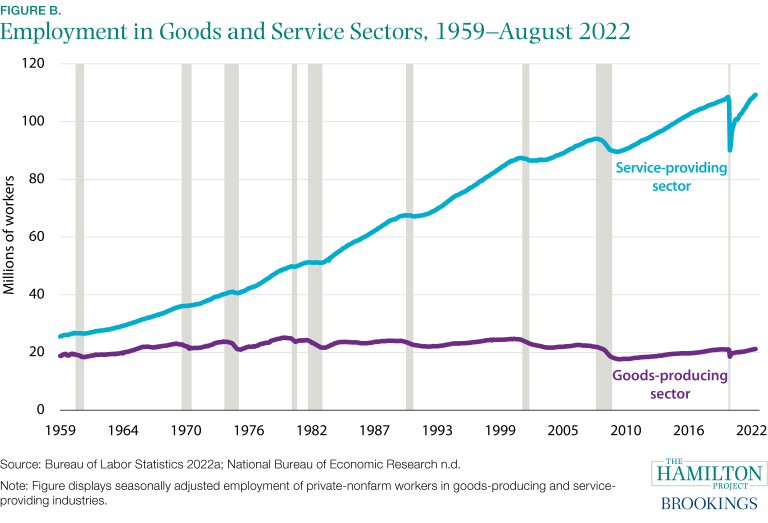
One of the reasons for this is that the US is primarily a service economy. As Brookings Institute here tells us, today four out of every five Americans work in the service sector:
The problem with service sector economies is that the service sector does not produce tangible goods or commodities, i.e. it’s not manufacturing anything, but rather simply offering services like transportation, hospitality, delivery, etc.
Every country’s economic compositions can be broken down into percentages, and it highlights some interesting things for us in this regard. For instance, here are the global rankings of countries by their service sector:
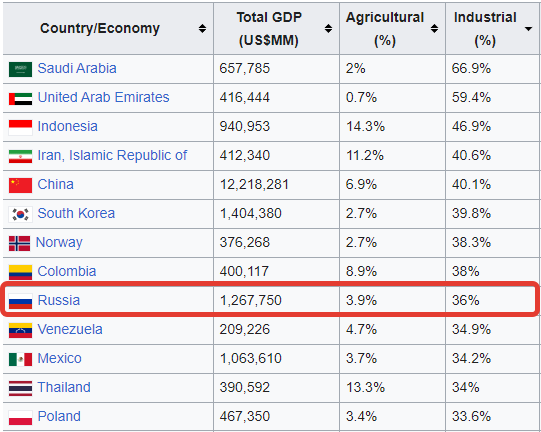
The U.S. is in 2nd place in the world with a whopping 79.7% of its economy being in the service sector. Russia is off the chart, at #24 with ~60% service sector.
Now let’s reorder the chart to show countries ranked by their industrial/manufacturing sector:
Here, Russia is a respectable 9th place with 36%. U.S. is at a dismal #33rd with ~19% of its economy in the industrial sector. Similarly, reordering by agriculture shows Russia coming in with nearly ~4%, and U.S. at 1.1%. And the total percentage of people employed in the manufacturing workforce for Russia is also amongst the world’s highest at 14.4%:
U.S.’s Holographic Sham Economy
In fact, there are many ‘accounting tricks’ the U.S. uses to merely inflate its GDP numbers to the moon by way of hyper-financialization. Not only does the endless Wallstreet/stockmarket digital hocus-pocus of money rotation add trillions of empty fluff—non-productive ‘fake’ GDP which has no real tangible value, and adds nothing to the real economy—but there are a myriad other devious ways the U.S. GDP numbers are pumped up.
This article describes some of them:
Effect of Financialisation on the GDP
In another vein, the US economy is so highly financialised that nearly half of the stated GDP consists merely of book entries transferring money from one account to another, not in any way comparable to the real production of manufacturing or the provision of real services. Many international economists have made statements to the effect that “When we remove the financialisation aspects from the accounts, the US real GDP is reduced by nearly 50% and the national per-capita income falls to about $15,000.”
Or how about this:
One clever trick by the US government is something called “imputed rent”, which means that if you own a house the government adds to the GDP the amount you would have had to pay in rent (but didn’t), on the mind-twisting basis that if you didn’t own that house you would have had to pay this rent. This one item alone added about $1.6 trillion, or 15% to the US GDP. Also, GDP is adjusted (downward) for inflation so, as you will see in a moment, the US badly understates its annual inflation rate which automatically inflates its GDP by about another $2.3 trillion, or about 20%. These two items alone mean the US GDP is falsely and artificially inflated by about 35%.
And as preposterous as it sounds, there appears to be truth to it. Other articles touch on this in more depth, like this one, which also mentions the UK:
Inclusion of how much home-owners would pay if they actually rented boosted UK GDP in 2014 by £158bn – a 8.9% share
The other way to explain the U.S.’s monstrously distorted economic hyper-financialization is: for instance healthcare, where a simple pregnancy can cost you $10,000 - 20,000 at the hospital, or a minor procedure can leave you with a $100,000 bill. These figures, like everything else, are all added to the ‘GDP’ of the ‘service economy’, vastly inflating the outward weight of the economy above countries which, for instance, can have that same medical care for 1/10th of the cost, yet their GDP will look on paper to be much smaller.
But why is the U.S. able to have such inflated rates? In the case of the healthcare example, because government subsidies like medicare/medicaid all pay for it, so the insurance companies can jack up the prices endlessly to make mega-profits. And why can the U.S. government afford to pay any price imaginable and allow such a system to spiral out of control without ever going broke? Simple: because, due to the famous U.S. ‘privilège exorbitant’, the U.S. can print money endlessly to pay for any governmental budgetary deficit without suffering the consequences.
Without getting into too much detail, as I plan to write a separate article on this very topic, the simple fact is that due to the U.S. Dollar being the global reserve currency, all other nations of the world are constantly in need of Dollars to make transactions, buy goods, and the general import/export operations of their economies. That means, in essence, the U.S. can ‘offload’ its Dollar debt onto other nations and spread the ‘inflation’ created from its own endless money printing all across the world, so that instead of the U.S. alone collapsing from sudden hyper-inflation, the entire world gradually absorbs an ever-increasing inflationary rising tide.
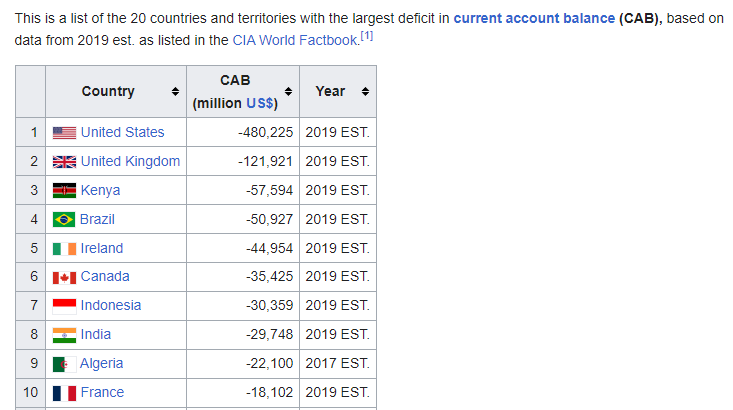
This is why, the U.S. is able to support a world-leading-ly negative ‘Current Account Balance’ deficit of nearly -500 billion.
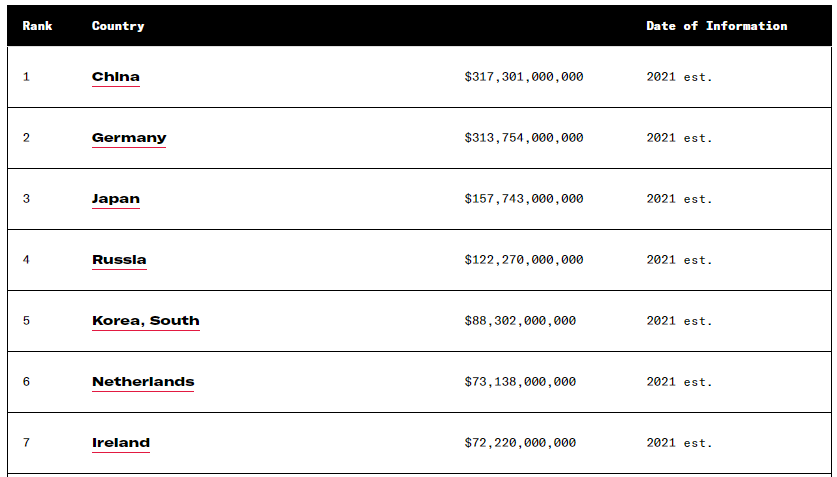
Russia on the other hand, is among the leading positive surplus account balance nations. Here’s the official CIA Factbook list from 2021:
And yes, in case you doubted, here’s the U.S. in literal last place on Earth, with the most egregious Current Account imbalance of 209 identified sovereign states and territories:
And for those wondering what the Current Account Balance indicates, exactly, here’s one description from wiki:
A current account surplus indicates that the value of a country's net foreign assets (i.e. assets less liabilities) grew over the period in question, and a current account deficit indicates that it shrank. Both government and private payments are included in the calculation. It is called the current account because goods and services are generally consumed in the current period.
A positive current account balance indicates the nation is a net lender to the rest of the world, while a negative current account balance indicates that it is a net borrower from the rest of the world. A current account surplus increases a nation's net foreign assets by the amount of the surplus, and a current account deficit decreases it by that amount.
And lastly:
If an economy is running a current account deficit, it is absorbing (absorption = domestic consumption + investment + government spending) more than that it is producing. This can only happen if some other economies are lending their savings to it (in the form of debt to or direct/ portfolio investment in the economy) or the economy is running down its foreign assets such as official foreign currency reserve.
On the other hand, if an economy is running a current account surplus it is absorbing less than that it is producing. This means it is saving. As the economy is open, this saving is being invested abroad and thus foreign assets are being created.
So a negative balance means you absorb more than you produce. The U.S. has the largest negative balance of any country on the planet. A positive surplus in your account balance means the country produces more than it ‘absorbs’ from others. And Russia has one of the largest positive surplus accounts in the world.
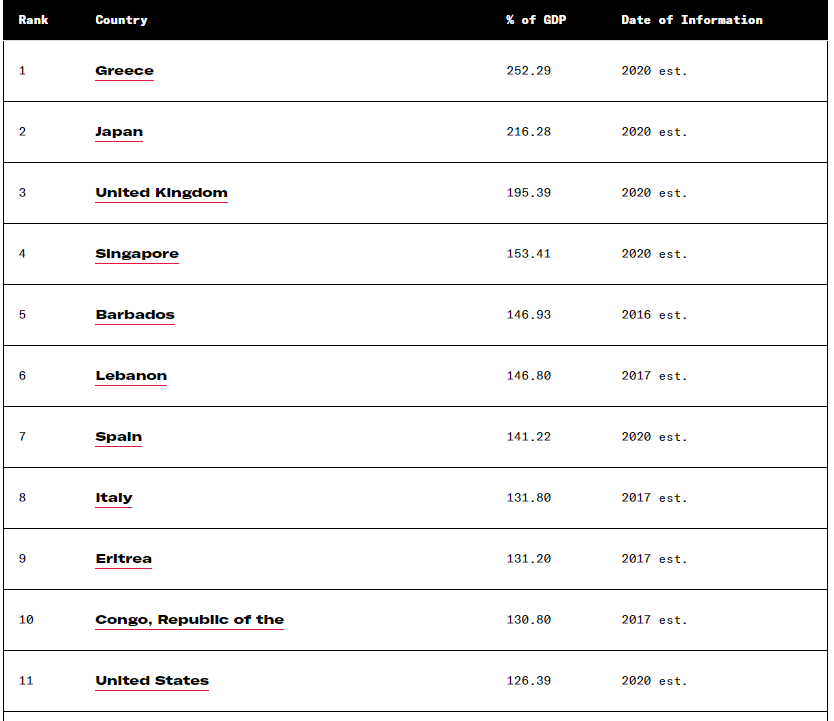
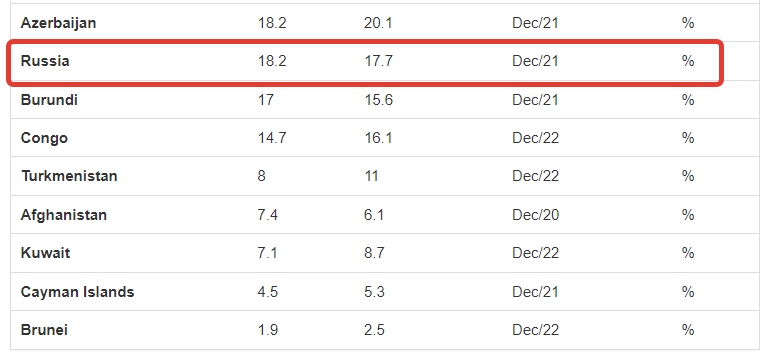
And again using the CIA Factbook, let’s check the Debt to GDP by country. Here the U.S. comes igominiously in 11th worst place with 126% Debt to GDP.
Russia, on the other hand, is only a few places away from the absolute lowest Debt to GDP number of any country in the world, with about ~18%:
But ultimately, as the excerpts quoted at the beginning of this section implied, the U.S. real GDP, when you take away all the fraudulent numbers and inflations, is probably somewhere around $7-10trillion or less. And I have seen experts calculate it to roughly this amount, which would represent less than half of the official Nominal GDP of $20-25 trillion.
And since we know Russia’s true real GDP (including Nominal) is in the range of $4T+, if you take away all the accounting tricks and manipulated ‘paper devaluations’ outlined in the first section, that means that the Russian economy is potentially only about half the size and productivity of the U.S. one in real terms. And this corresponds to Russia having a little less than half the population.
Compared on a one to one basis, if you scaled up the Russian population to match, then the Russian economy likely wouldn’t be that far off from the American. Now take away the ‘privilege exorbitante’ which is the source of the U.S.’s real power, take away the handicap of the world’s most pernicious sanctions, embargoes, and economic terrorism that hamstrings the Russian economy, and what are you left with? Likely a scenario where Russia would even overtake the U.S.
On the Precipice of the Future
And with the current direction things are headed in, de-dollarization will eventually bring about the end of the Dollar Hegemony, Petrodollar, World Reserve Currency status, etc. Sure, it may take much longer yet, as some argue. But things do appear to be accelerating on that front.
Just today, it was reported that India seeks to trade in its own native currency with more countries, including Malaysia.
The article mentions that India already trades in Rupees with Russia, Iran, and several others, and is expanding a policy of dedollarization by increasing the use of Rupees with other more major nations like Bangladesh:
In addition, Bangladesh is also eyeing to start trading with India using INR, after the ministry of commerce placed a written recommendation at the last cabinet meeting regarding the possibility and opportunity of using rupee instead of dollar.
"The use of rupee will start with Bangladesh’s $2 billion trade with India. Bangladesh Bank has almost finished all kinds of trials in this regard. Trading in rupee will be introduced in both countries only after bilateral decision on some issues," an executive director of Bangladesh Bank said.
This comes on the heels of news several days ago that BRICS are working on a new form of currency for their own use:
"The transition to settlements in national currencies is the first step. The next one is to provide the circulation of digital or any other form of a fundamentally new currency in the nearest future. I think that at the BRICS [leaders' summit], the readiness to realize this project will be announced, such works are underway," Babakov said on the sidelines of the Russian-Indian Strategic Partnership for Development and Growth Business Forum.
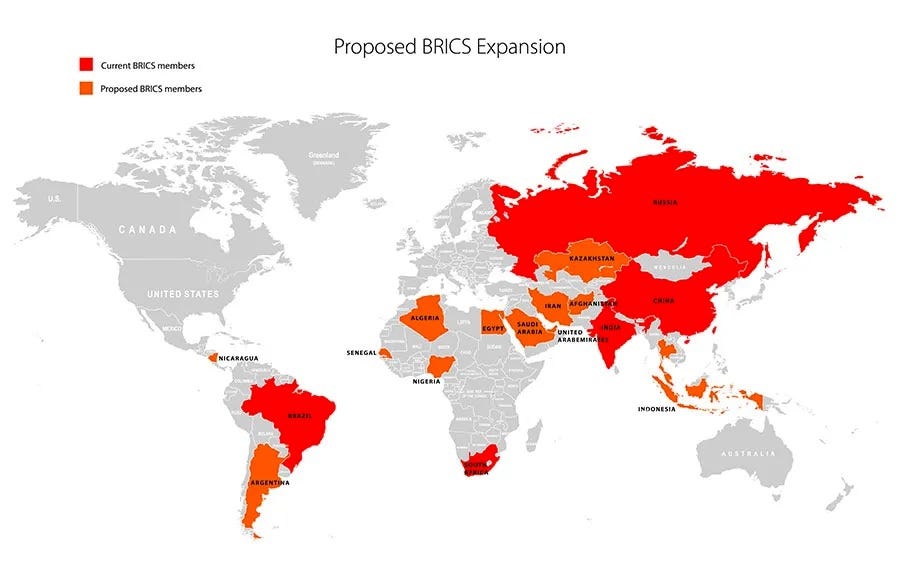
And the fact that the total number of countries now clamoring to join BRICS has surged to 20+, this lays the groundwork for some earth-shattering changes in the medium term future.
If accepted, the new proposed BRICS members would create an entity with a GDP 30% larger than the United States, over 50% of the global population and in control of 60% of global gas reserves.
The above map even leaves some out, as for instance even Mexico has now expressed interest in joining.
Top financial site, Financial Times (FT), is slowly preparing their readers for the eventuality:
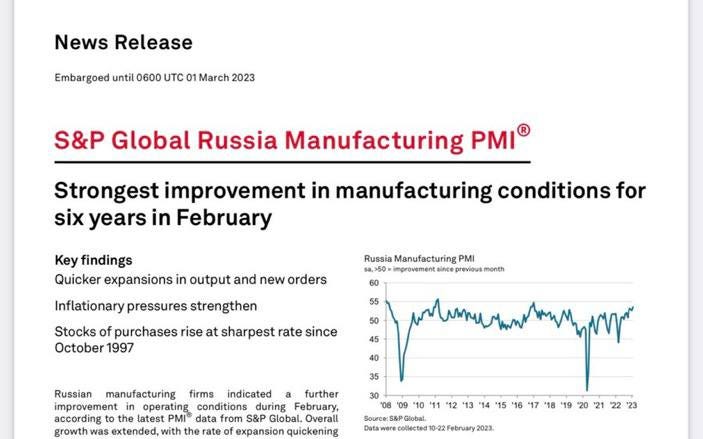
All the while, Russia’s economic prospects continue to grow as the Eurasian bond between Russia-China strengthens them both. Last month, Russia’s manufacturing sector has even shown its largest increase/improvement in six years:
It’s nothing but misery and complaints for the West. They’ve lost control of the plot and no longer have the levers to affect Russia economically, particularly now that Russian import substitution and economic re-orientation have allowed it to completely rewire its imports/exports to the East. Just listen to this:
That means, the U.S. only had one chance to fully drown the Russian economy with its ‘crippling’ sanctions and economic terrorism, but it was a very risky ‘all or nothing’ gambit on the part of the Atlanticists. If they had succeeded in their plans by totally unplugging Russia from the Western economic system, they would have achieved an irreparably damaged Russia. But instead, they completely neutered themselves of their only last remaining ace up their sleeve.
Russia has survived, stronger than ever, and now that it is severed from their systems, there is no way left for them to exact economic damage. Last month Josep Borrell stated exactly that when he said:
“There is not much more to do from the point of view of sanctions, but we can continue to increase financial and military support,” Borrell told EURACTIV in Stockholm, following a meeting of EU defence ministers.
In short, he’s saying they have completely exhausted all options on sanctions, and the only thing the useless, sniveling, impotent Eurocrats can now do is continue pumping Kiev full of weapons.
And lastly, as a culmination of everything herein, and showing how successfully Russia has broken free of the Western financial system tentacles, Russia has last week ordered all its banks to stop using the SWIFT bank transfer system.
How the tables have turned. It was only a year ago that the West hung the threat of cutting Russia off from SWIFT over Russia’s head as an unprecedented action that evoked predictions of Russia’s ensuing financial demise. And now, it is Russia itself cutting the cord, discarding the now-replaced SWIFT system like a used rag, proving once again that Russia’s historic trajectory is now set.
If you enjoyed the read, please consider subscribing to a monthly pledge to support my work, so that I may continue providing you with incisive reports like this one.
Alternatively, you can tip here: Tip Jar


















Great analysis. I really like Electricity Production as a proxy of a country's true output. Never thought of it like that but really makes sense; and if I look at it as a kW/population then Japan and Russia are pretty similar - NOT expected at all.
Regarding the currency wars, we do hear a lot about a BRICS currency and all that; but what is holding that back (and will for the forseeable future) is that China still has capital controls and the Yuan is not a freely traded currency. Until it is, this is not a realistic alternative. Of course, the Chinese have shown recently that they are perfectly capable of changing on a dime, so lets see.
On economic/military output - I am starting to understand the western strategy to defeat Russia. They seem to believe that Ukraine can fight Russia to a kind of stalemate on the ground, and that over the course of 2+ years western industrial output will eventually overwhelm them. Cold War Redux. In this sense, the strategy of attrition vs territory has an obvious weakness.
Quite correct, Russia's economy needs to be measured by non-Western objective methods. Having closely followed Russia's economic development since 2010, and less closely since the dissolution of the USSR, one of the best metrics describing the state of Russia's economic health comes from Russia's government and its many internal discussions on the topic. One of the more interesting observations overlooked by the West Putin has made on many occasions--that USSR/Russia has always been under illegal sanctions and was thus forced to adopt programs to deal with them well before those levied in 2014 and again in 2022. Indeed, many objective observers have written that illegal Western sanctions have served as a boon for Russia's economic development as it was forced to become self-sufficient in as many areas as possible. Yes, there are sectors of Russia's economy that remain moribund, like that of forestry products; however, the latest meeting Putin had with some government members that discussed the economy on 29 March here, http://kremlin.ru/events/president/news/70800 shows great progress in many areas as Russia continues to implement as reflected in Putin's remarks at the beginning of that meeting:
"As you know, recently at a meeting with representatives of business, big business, we talked about the new growth model of our economy and what needs to be done to support it. I suggest that today, together with members of the Government and the leadership of the Central Bank, we also discuss this topic and return to what we discussed with the business community." http://kremlin.ru/events/president/news/70688
The meeting Putin referred to occurred prior to Xi's visit, The Plenary Session of Annual Congress of the Russian Union of Industrialists and Entrepreneurs. What becomes very evident from the meeting is the fact that the sanctions have helped Russian corporations become vertically organized in a manner they weren't before by owning and thus controlling their entire supply chains. In your analysis, you mentioned the share of Russia's economy engaged in manufacturing versus services. What's happening thanks to the sanctions is the manufacturing portion will continue to increase, and as Russia's internal market strength continues to improve, demand for its own manufactures will increase thus further stimulating the internal market and so forth in a manner similar to that of China. That strengthening will continue at least through 2030 as Russia still has 10% of its population under its poverty threshold and another 20-30% above it but still in a lower wage realm that raising's discussed by government as one of its strategic goals. In short, the illegal sanctions regime provided a huge boot to the bear's behind and provided motivation that was lacking. Add the Hybrid Third World War against Russia to the mix, and Russia couldn't have provided a better formula for its economic resurrection and future potential. On top of that, Russia's "new growth model" lacks the constraining overhead typical of Neoliberalism similar to that of China where what's being molded by Putin and his associates's direction is Socialism with Russian Characteristics.
As for the Outlaw US Empire's economy, it's being strangled by Neoliberal Parasitism as Hudson detailed in his "Killing the Host" as its GDP as you noted is massively less than what's proclaimed, not just due to falsification of the economic numbers but primarily due to the overhead costs generated by Neoliberalism which as you noted are counted as plusses to GDP. But it's not sufficient to just remove those costs as plusses, they must be subtracted once again as costs to GDP. So, if healthcare costs are 15% of GDP, then that 15% must be subtracted twice for its actual effect on GDP to be seen. The same goes for all other overhead costs. In my discussions with Dr. Hudson on this topic, it's our opinion that US GDP is close to 50% overstated. And now with the massive banking insolvency is possibly even larger. Do see his latest podcast with Radhika Desai, "The Treasury Privatized?" https://michael-hudson.com/2023/03/the-treasury-privatized/ for a discussion on that topic.
So, there's a very fundamental reason why the US can't ramp up its munitions production or produce any sort of competitive weapons system, particularly aircraft, and that's due to the nature of its political-economy which is designed to extract wealth from as many sources as possible rather than generating wealth via production and productive activities. In so many ways, the USA is living off what was produced in the past, not on what's being created today or planned for the future. Indeed, as Hudson and Desai explain, the complete lack of investment into fundamental industrial capitalist pursuits combined with its astronomical overhead dooms the US economy to a form of pauperism that's already arrived and escalating.
A point I make about the utilization of patents as protectionism is that Nature's secrets are open to discovery by anyone, and Nature provides the basis for economic life. It is thus impossible to monopolize Nature despite the desire to do so. Today's geoeconomic dynamic shows two blocs going in different directions: The Multipolar World Bloc led by Russia and China is ascending while the Outlaw US Empire Bloc is descending with two exceptions--Japan and South Korea--and the only reason why the latter aren't descending is their ties to the dynamically ascending Eurasia.